
Related News
- 00
0000-00
How to size heavy-duty loaders for North American mining operations - 00
0000-00
How altitude affects mining excavator performance in Latin America - 00
0000-00
Caterpillar Launches New Cat 6060 and Upgraded Autonomous Mining System - 00
0000-00
When does eco-friendly construction equipment pay for itself? - 00
0000-00
Will a wheel loader quick coupler fit your existing attachments?
Why does a construction machinery guide focus on total ownership cost instead of purchase price?
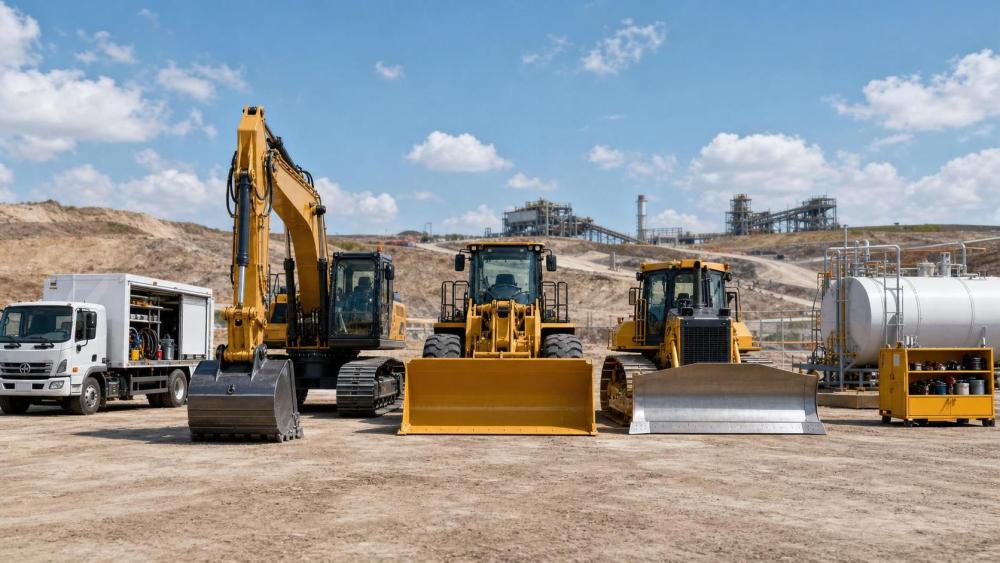
A low quote can hide an expensive machine life. That is the central idea behind any serious construction machinery guide.
In heavy equipment, the invoice is only the starting point. Fuel burn, maintenance intervals, wear parts, downtime, operator output, and resale value usually decide real profitability.
This matters even more when fleets include crawler excavators, wheel loaders, motor graders, bulldozers, and skid steer loaders across mixed job conditions.
A machine that costs more upfront may still win if it moves more material per hour, uses less fuel, and avoids unplanned stoppages.
EMD often frames this issue through asset utilization. The machine is not only a purchase. It is a long-cycle production asset tied to site schedules and contract risk.
That perspective is useful in today’s market. Emission rules are tightening, autonomy features are expanding, and telematics data is becoming part of cost control.
So the better question is not, “Which model is cheaper?” It is, “Which model produces the lowest cost per productive hour over its useful life?”
Which cost items should be compared before choosing a machine?
A practical construction machinery guide should separate visible costs from operating costs. That makes comparisons more consistent across brands and machine classes.
The table below works as a quick decision screen before deeper technical review.
In practice, these items behave differently by machine type. An excavator may be undercarriage-sensitive. A loader may be tire and fuel sensitive. A grader may be precision and electronics sensitive.
That is why EMD’s market intelligence tends to connect machine physics with commercial outcomes, not just product specifications.
How do fuel efficiency and uptime change the real cost picture?
These two factors usually separate a cheap machine from a cost-efficient one. They also shape whether a fleet meets schedule pressure without adding backup units.
Fuel efficiency should be measured against actual duty cycles. Comparing brochure figures alone is rarely useful.
For example, a crawler excavator in trenching, rock work, and mass excavation will show different consumption patterns. Hydraulic response and idle management become decisive.
The same applies to wheel loaders in short-cycle loading. Travel distance, bucket fill factor, and rehandling conditions can distort simple liters-per-hour comparisons.
Uptime is even more strategic. One unexpected failure during a critical earthworks window can trigger labor inefficiency, subcontractor delays, and penalty exposure.
A strong construction machinery guide should ask for service response time, parts stocking, failure diagnostics, and mean time to repair.
- Check whether telematics can flag idling, overload, or overheating before failure occurs.
- Ask for local parts availability on filters, hoses, pumps, undercarriage items, and electronic controllers.
- Review warranty exclusions for high-dust, abrasive, or remote-site operations.
Where EMD’s coverage becomes relevant is in linking machine architecture to uptime risk. Electro-hydraulic controls, hydrostatic systems, and remote diagnostics can improve performance, but they also require stronger support capability.
Is the most productive machine always the lowest-cost option?
Not automatically, but productivity often outweighs purchase price when utilization is high. The key is to compare output against all related operating costs.
Take a motor grader with advanced GPS or laser guidance. Its upfront cost may be higher, yet it can reduce rework, improve surface accuracy, and shorten pass counts.
That changes the economics beyond fuel. It may lower survey dependency, material waste, and project correction costs.
A bulldozer with stronger traction control may also cost more. Still, on difficult terrain it can maintain push efficiency where a cheaper unit slows down or wears faster.
More compact machines follow the same logic. A skid steer with broad attachment compatibility can replace several single-function tools in urban or confined jobs.
A useful decision method is to compare machines through cost per productive unit, not cost per owned unit.
- For excavators, compare cost per cubic meter moved.
- For loaders, compare cost per ton loaded or transferred.
- For graders, compare cost per finished area within tolerance.
- For bulldozers, compare cost per bank cubic meter pushed.
That approach fits the broader EMD view that infrastructure equipment should be judged by utilization, precision, and lifecycle contribution, not only asset count.
What mistakes distort ownership-cost comparisons most often?
The most common mistake is comparing machines on an empty spreadsheet. Real jobs are not neutral. Ground conditions, haul patterns, climate, and operator skill all change results.
Another mistake is ignoring attachment and technology compatibility. A lower-priced base machine may require extra integration cost later.
This is increasingly important as fleets move toward decarbonization, autonomy, and data-led maintenance. Compliance and control architecture now affect future value.
A short checklist helps avoid misleading comparisons.
- Do not use fuel assumptions from another site or another operator profile.
- Do not treat warranty as a substitute for strong local service coverage.
- Do not ignore resale differences between well-documented and poorly documented service histories.
- Do not assume the newest control technology adds value if operators cannot use it effectively.
- Do not overlook emission-stage mismatch for future cross-border deployment or tender eligibility.
In more advanced reviews, it is worth testing sensitivity. A machine that looks economical under low diesel prices may lose its advantage when fuel rises or uptime falls.
How should a final comparison be built before committing capital?
A strong construction machinery guide should end with a disciplined comparison model. It does not need to be complicated, but it must reflect actual deployment.
Start with the machine’s primary role. Then map production targets, annual hours, site conditions, support radius, and expected ownership period.
From there, compare three layers together: financial cost, technical fit, and future risk.
This is where industry intelligence becomes useful. EMD’s coverage of emission regulation changes, electrification trends, hydraulic efficiency, and remote-control systems can sharpen these judgments.
The practical next step is simple. Build a side-by-side ownership model for shortlisted machines, using site-based assumptions instead of catalog assumptions.
Then stress-test the result against downtime, fuel volatility, and residual value. A reliable construction machinery guide should help reveal which machine stays economical when conditions become less favorable.
That is usually the better investment signal. Not the lowest entry price, but the machine most likely to protect output, compliance, and value through its full operating cycle.